Statistics
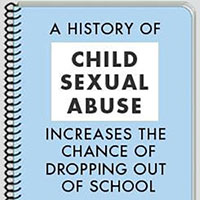
What are the Consequences of Abuse
Emotional and mental health problems are often the first consequence and sign of child sexual abuse.
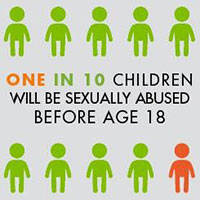
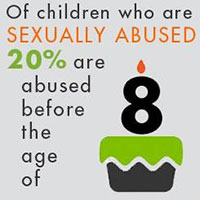
How Big is the Problem?
Child sexual abuse is far more prevalent than people realize.
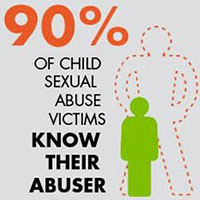
Who Abuses?
Those who molest children look and act just like everyone else. Abusers can be neighbors, friends, and family members.
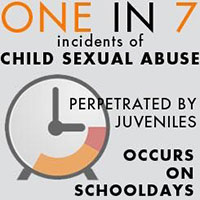
What are the Circumstances of Abuse?
Child sexual abuse takes place under specific, often surprising circumstances.
What are the Risk Factors?
While no child is immune, there are child and family characteristics that can heighten the risk of sexual abuse.
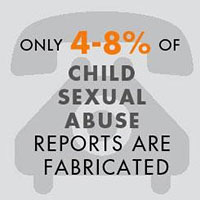
Facts on Reporting
Only about one-third of child sexual abuse incidents are identified and even fewer are reported.
All Statistics
All the statistics are available together below.